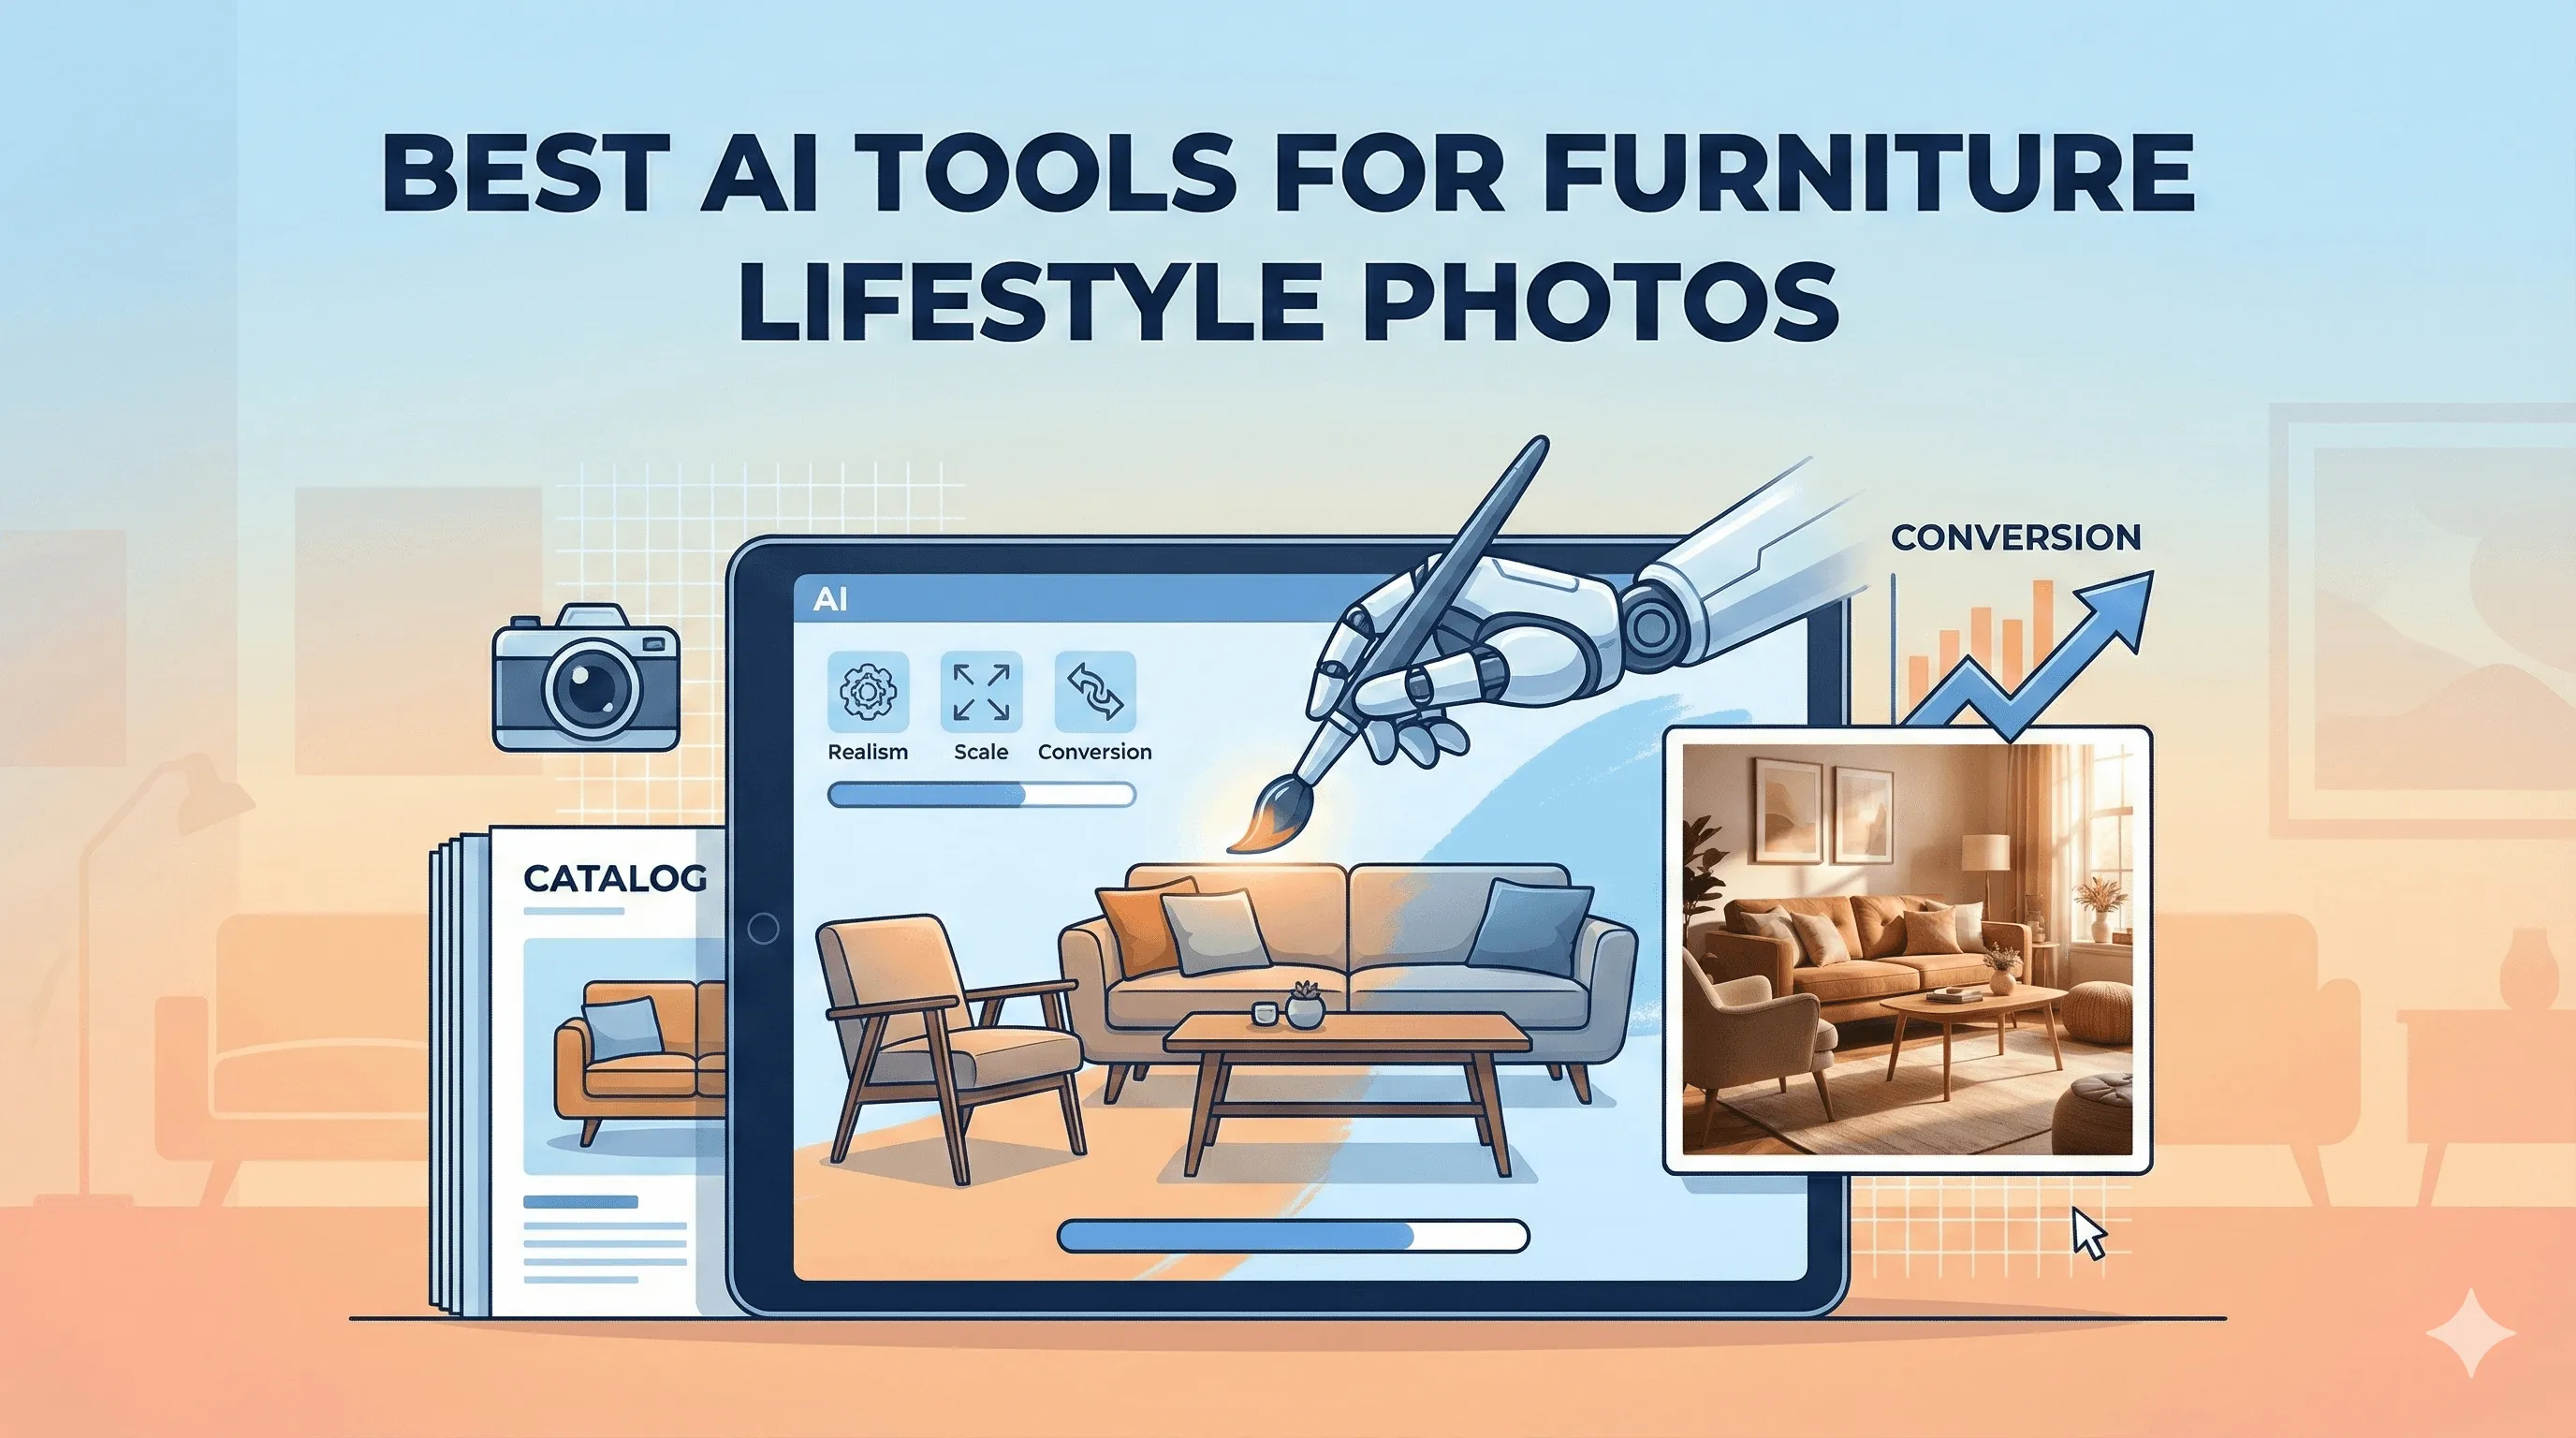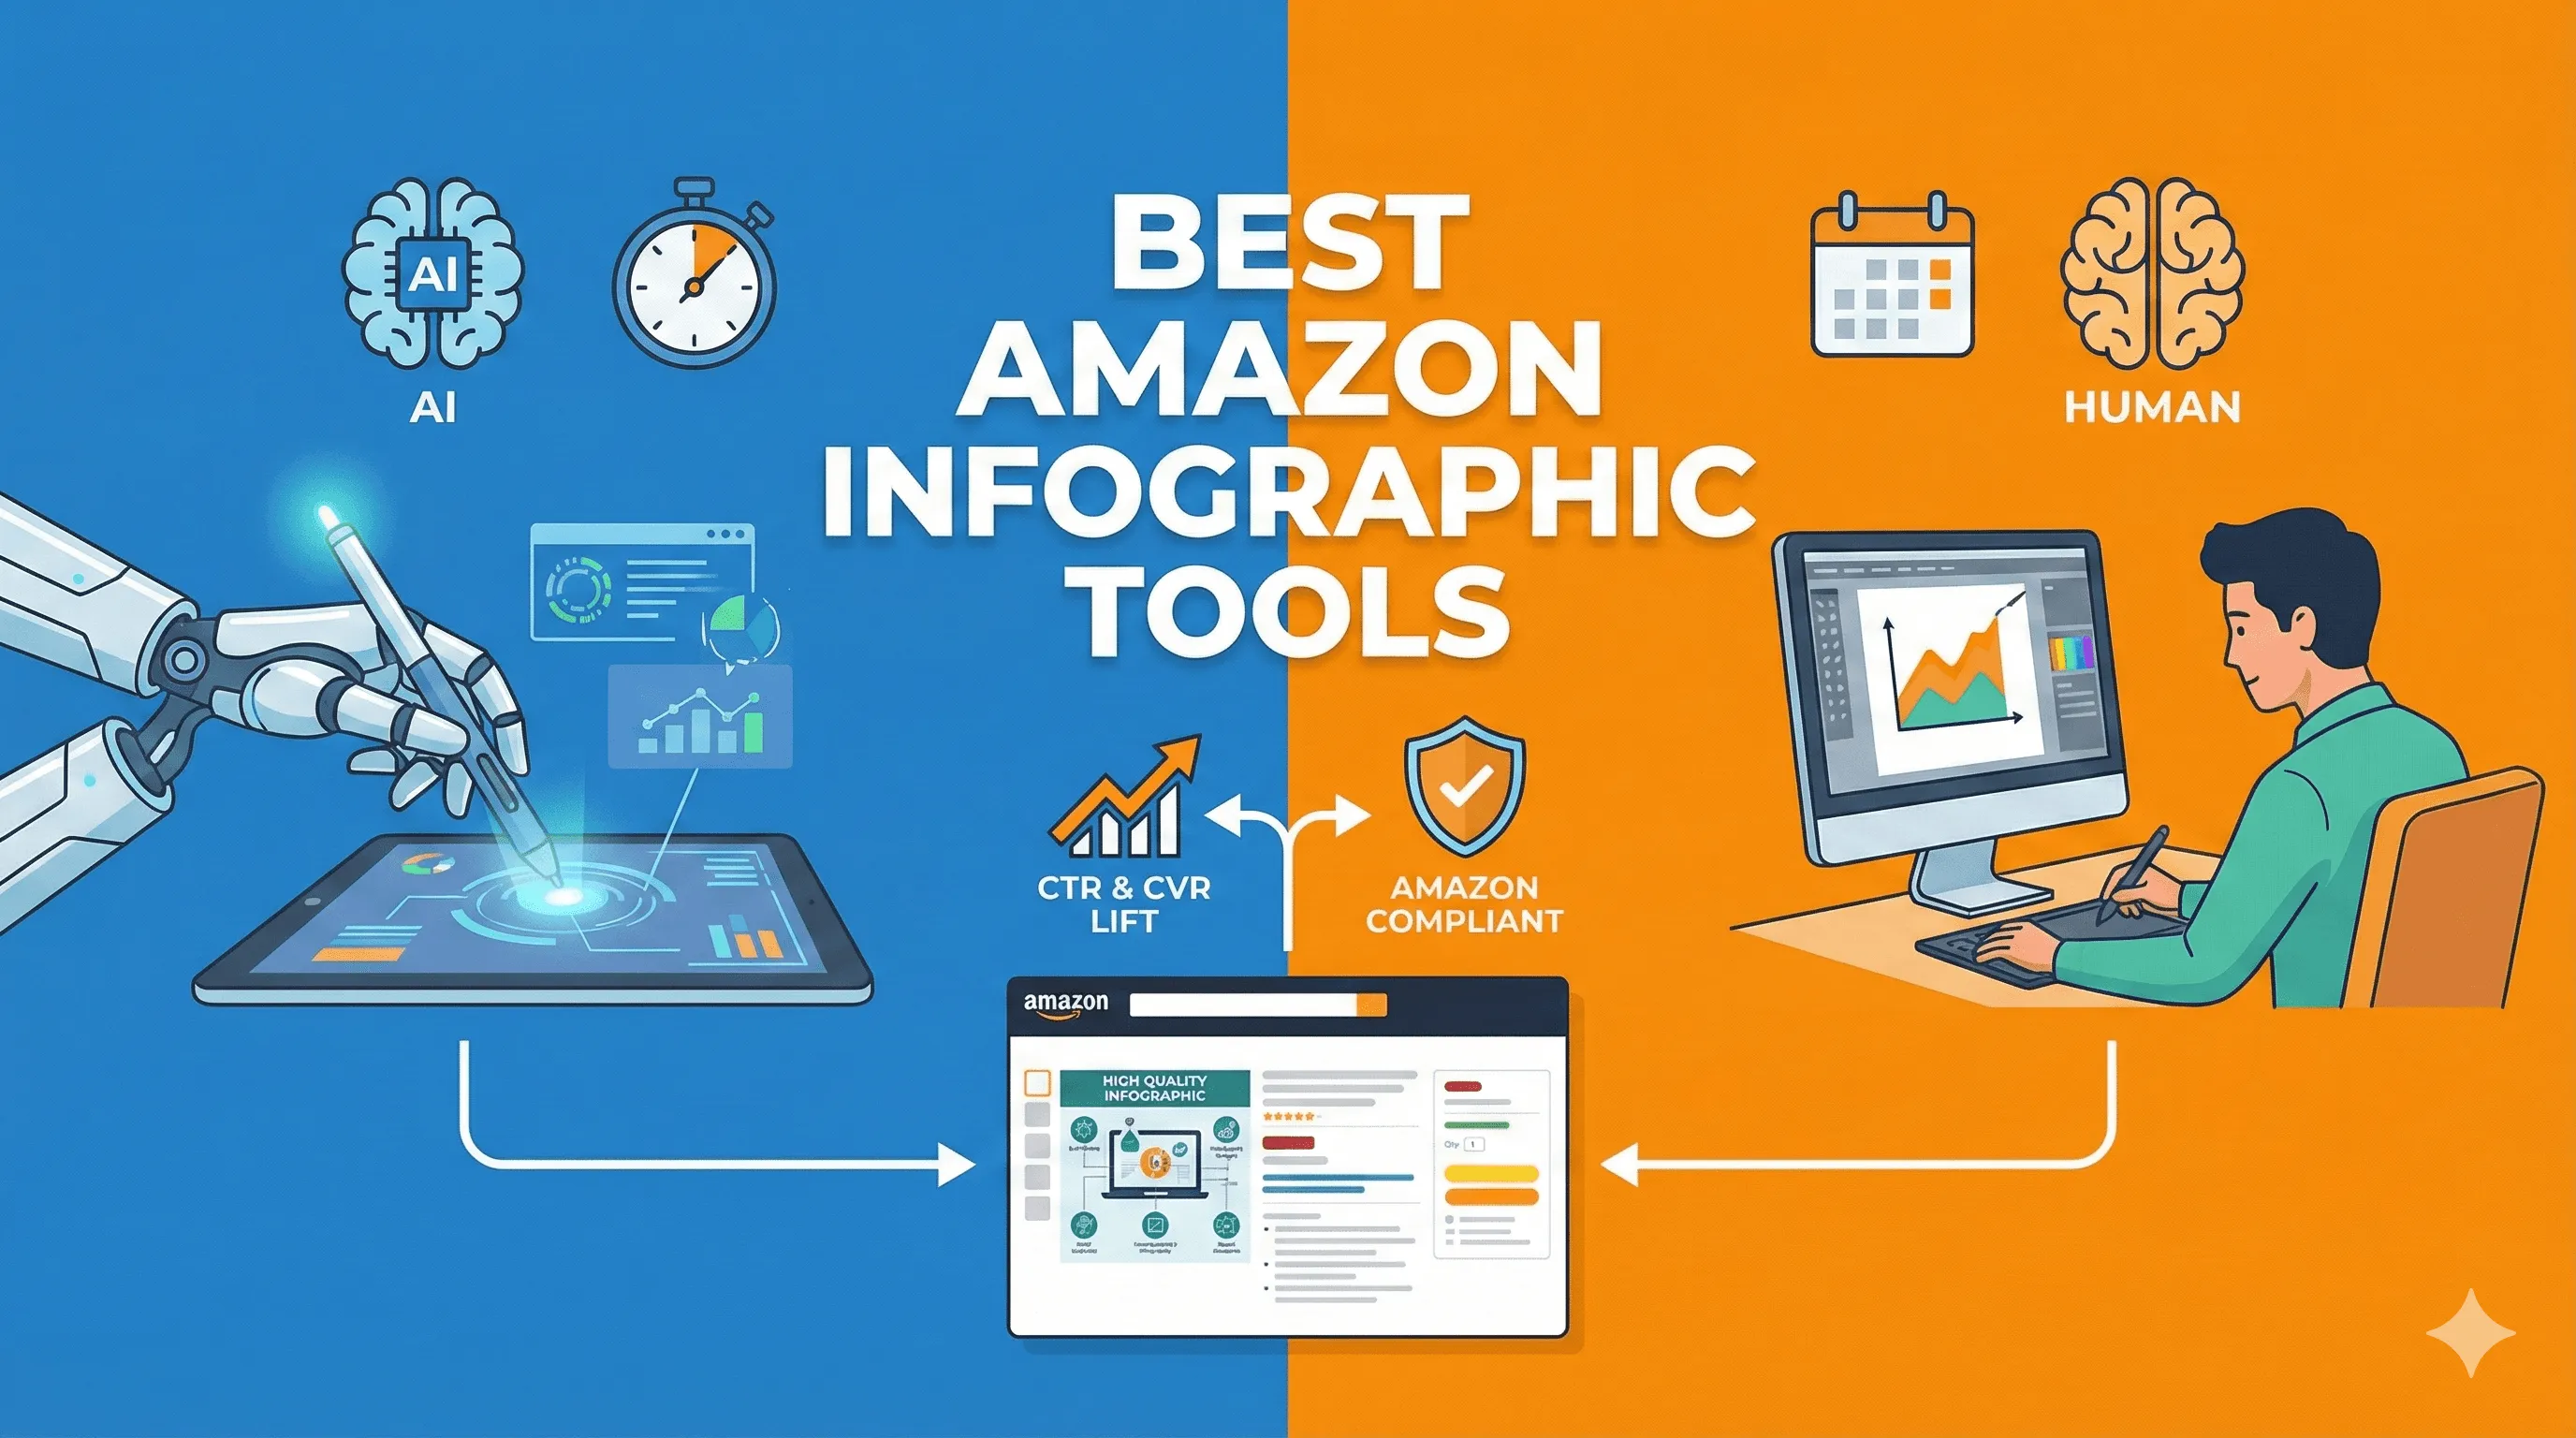
The best Amazon infographic tools are the ones that ship clear, mobile-first visuals fast, stay compliant, and scale across many ASINs, not just make a nice single image. For most teams, the winners fall into five buckets: an Amazon-native workflow system for scale, a template editor for speed, a pro editor for control, and a light AI layer for drafts and variations.
3 experts’ quick takes
- Conversion optimizer: Infographics win when they cut confusion in two seconds, show size and use, and answer the top objection before the shopper scrolls. Anything that slows that down hurts CVR.
- Agency operator: Throughput and standardization matter more than raw creativity. Fewer revision loops and a repeatable stack beat bespoke one-offs every time.
- Creative director: Hierarchy and legibility on a phone decide trust. Big type, few claims, strong contrast, and consistent spacing signal quality.
| Tool category | Best for | Pros | Cons | Time to ship | Scale fit | Compliance risk | Notes |
|---|---|---|---|---|---|---|---|
| Pixii (AI + editable templates) | Catalog-scale infographics | Amazon-native workflow, fast edits, consistent stacks | Subscription cost | Minutes to hours | Excellent | Low | Built for 7-image stacks and reuse |
| Template-based design editor | Speed on simple layouts | Easy templates, low learning curve | Limited control | Hours | Good | Medium | Watch mobile legibility |
| Pro raster editor | Pixel control | Full control, advanced effects | High labor cost | Days | Poor | Medium | Best for hero details |
| Vector illustration editor | Icons and diagrams | Clean vectors, scalable | Slower for photos | Days | Fair | Low | Pair with photos |
| UI/layout tool | Structured layouts | Strong grids, components | Export friction | Days | Fair | Low | Good for systems |
| Slide editor workflow | Budget and speed | Fast charts, easy edits | Looks generic | Hours | Fair | Medium | Keep claims minimal |
| Diagram/annotation tool | Callouts and labels | Clear arrows and labels | Limited styling | Hours | Fair | Low | Use sparingly |
| 3D render tool category | Complex products | Exploded views | High effort | Days | Poor | Medium | Use only when needed |
| Background removal tool category | Clean cutouts | Fast prep | Not a full editor | Minutes | Good | Low | Prep step only |
| Generic AI one-off generator | Draft ideas | Fast variations | Inconsistent text | Minutes | Poor | High | Needs human cleanup |
Key takeaways
- “Best” means faster shipping, clearer answers, and lower rework, not more effects.
- Scale comes from systems, not talent alone. Lock a pattern, then apply it.
- Mobile legibility beats desktop polish for Amazon.
- Compliance mistakes create hidden costs through rework and suppression.
- Cost per ASIN over time matters more than sticker price.
Quick picks by outcome
Best for speed
Template-based design editors and slide workflows move fastest for simple callouts and charts. Pair with light AI for first drafts.
Best for consistency across a catalog
Pixii-style AI plus editable templates win when you need the same structure across many ASINs, weekly refreshes, and fast edits. https://pixii.ai/
Best for pixel-perfect control
Pro raster and vector editors deliver total control, but expect higher labor and slower iteration.
Best for agencies
A system that saves playbooks, enforces brand rules, and supports quick revisions keeps margins healthy at volume. https://pixii.ai/pricing
Best for budget
Slides and general template editors are fine for early-stage sellers, if you keep claims tight and readable.
What good Amazon infographics actually do (CVR, trust, fewer returns)
Great infographics reduce cognitive load. They answer “will this fit,” “what’s included,” and “how do I use it” at a glance. That clarity builds trust and reduces returns by setting accurate expectations. Poor infographics do the opposite: too many claims, tiny text, and clutter that forces shoppers to guess.
Amazon constraints you cannot ignore
Main images have strict rules, while secondary images allow more flexibility, but still require accuracy and clarity. Text overlays are allowed on secondary images, not on the main image, and claims must be truthful and supported. Always separate compliant main image work from expressive secondary images. (https://sellercentral.amazon.com/help/hub/reference/external/G1881)
A simple “how to choose” framework (3 to 6 criteria)
- Mobile legibility: Can a shopper read the claim in one second on a phone.
- Revisions speed: How fast can you change one word or number without redoing the image.
- Brand consistency system: Can you lock fonts, colors, spacing, and reuse them.
- Asset management: Can you store icons, badges, and dimensions once and reuse them.
- Compliance risk: How likely is the tool to nudge you into rule-breaking layouts.
- Cost per ASIN over time: Labor and rework dominate at scale.
Step-by-step: AI + human workflow to ship better infographics this week
- Diagnose what to explain. Pull the top three buyer questions from reviews and Q&A. Check that each will map to one image. Failure mode: trying to answer everything in one graphic.
- Draft fast with AI. Generate a rough layout and copy to set hierarchy. Failure mode: letting AI cram too many claims.
- Apply a consistent template. Lock headline size, spacing, and icon style so every ASIN looks related. Failure mode: one-off layouts that drift.
- Edit to clarity. Use human judgment to cut words, increase contrast, and verify measurements. Failure mode: tiny text and weak contrast.
- Compliance check. Confirm no forbidden claims and no text on the main image. Failure mode: rework after upload.
- Ship and iterate. Watch conversion and returns, then swap one claim at a time. Failure mode: changing everything at once.
When Pixii wins (concrete and testable)
Pixii wins when you have many ASINs, need weekly refreshes, or run an agency workflow that values consistency. It is strongest when you want Amazon-native infographics as part of the full 7-image stack, fast edits without re-prompts, and a repeatable playbook you can apply across the catalog. https://amazon-listing-grader.pixii.ai/
Common mistakes (infographics that hurt conversion)
- Too many claims in one image.
- Small text that fails on mobile.
- Decorative icons that add no meaning.
- Inconsistent spacing across images.
- Claims that oversell and trigger distrust.
- Forgetting scale references for size.
FAQ
Q: How many infographic images should a listing have. A: Usually two to four, each with one job. More images are fine if each answers a distinct question.
Q: Do infographics really lift conversion. A: Yes, when they reduce confusion and answer objections quickly. The lift varies by category and execution.
Q: Can I reuse the same layout across products. A: Yes, and you should. Consistency speeds production and builds trust.
Q: Is AI alone enough. A: AI is great for drafts. Human edits are still needed for clarity, accuracy, and brand fit.
Q: What about returns. A: Clear dimensions and usage reduce mismatched expectations, which lowers returns.
Q: How often should I refresh infographics. A: Quarterly for stable products, more often if reviews or competition change.